Area (Component)
The Area component takes a PointsArray prop, a value for the "bottom" of the area, and some options for styling/animating, and returns a Skia Path element to draw the line chart.
For visualizing ranges or error bounds around a line, check out the AreaRange component.
Example
import { CartesianChart, Area } from "victory-native";
import DATA from "./my-data";

export function MyChart() {
  return (
    <CartesianChart data={DATA} xKey="x" yKeys={["y"]}>
      {({ points, chartBounds }) => (
        //👇 pass a PointsArray to the Line component, y0, as well as options.
        <Area
          points={points.y}
          y0={chartBounds.bottom}
          color="red"
          animate={{ type: "timing", duration: 300 }}
        />
      )}
    </CartesianChart>
  );
}
Props
points
A PointsArray array that comes from a field of the points object exposed the children render function of CartesianChart, as illustrated in the example above.
y0
A number that indicates where the "bottom" of the area path should run. This number should be in canvas coordinates.
animate
The animate prop takes a PathAnimationConfig object and will animate the path when the points changes.
curveType
A CurveType value that indicates the type of curve should be drawn (e.g. linear or natural).
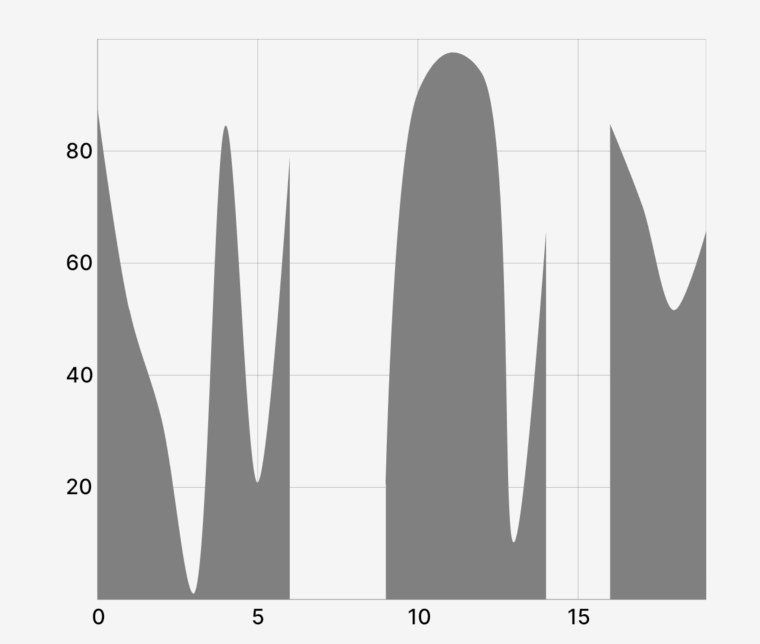
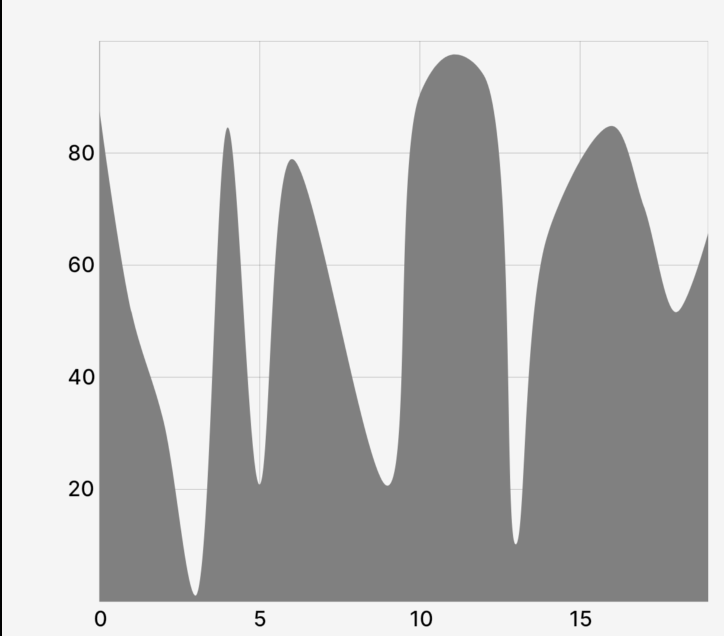
connectMissingData
The connectMissingData: boolean value that indicates whether missing data should be interpolated for the resulting Path. If set to true, the output will be a single, connected area chart path (even if there are missing data values). If set to false, if there is missing data values – the path will consist of multiple disconnected "parts".
connectMissingData={false}
connectMissingData={true}
children
A children pass-thru that will be rendered inside of the Skia Path element, useful if you'd like to make e.g. a gradient path.
Paint properties
The Area component will also pass the following painting props down to the underlying Path component:
colorblendModeopacityantiAlias